Spring 2022
March 31, 2022
In this Spring 2022 Investor Update, we introduce new charts and data describing the Ujima Good Business Alliance, categorizing the Ujima Fund’s investments, and updated information on the Ujima Fund’s investments and investors.
In this Spring 2022 Investor Update, we introduce new charts and data describing the Ujima Good Business Alliance, categorizing the Ujima Fund’s investments, and updated information on the Ujima Fund’s investments and investors.
About Ujima Fund Investments
Investments by Type

Note: Ujima matches loan products to align with a business’s stage of growth and dollar amount needed.
- Startup loans are made to pre-revenue businesses or businesses that have no history of sales.
- Microfinance loans are made to businesses that have history of sales but may not be profitable.
- Small business loans are made to businesses with at least 2 years of financial history.
- Growth loans are given to businesses with at least 2 years of financial history and a record of being profitable.
Ujima knows that community needs extend beyond small businesses, and also intends to invest in other community-identified needs through these two vehicles:
Major initiatives are investments in major projects and infrastructure such as community-owned internet or alternative energy.
Real estate investments are partnership deals, rehab, and/or acquisition real estate projects with experienced value-aligned investors.
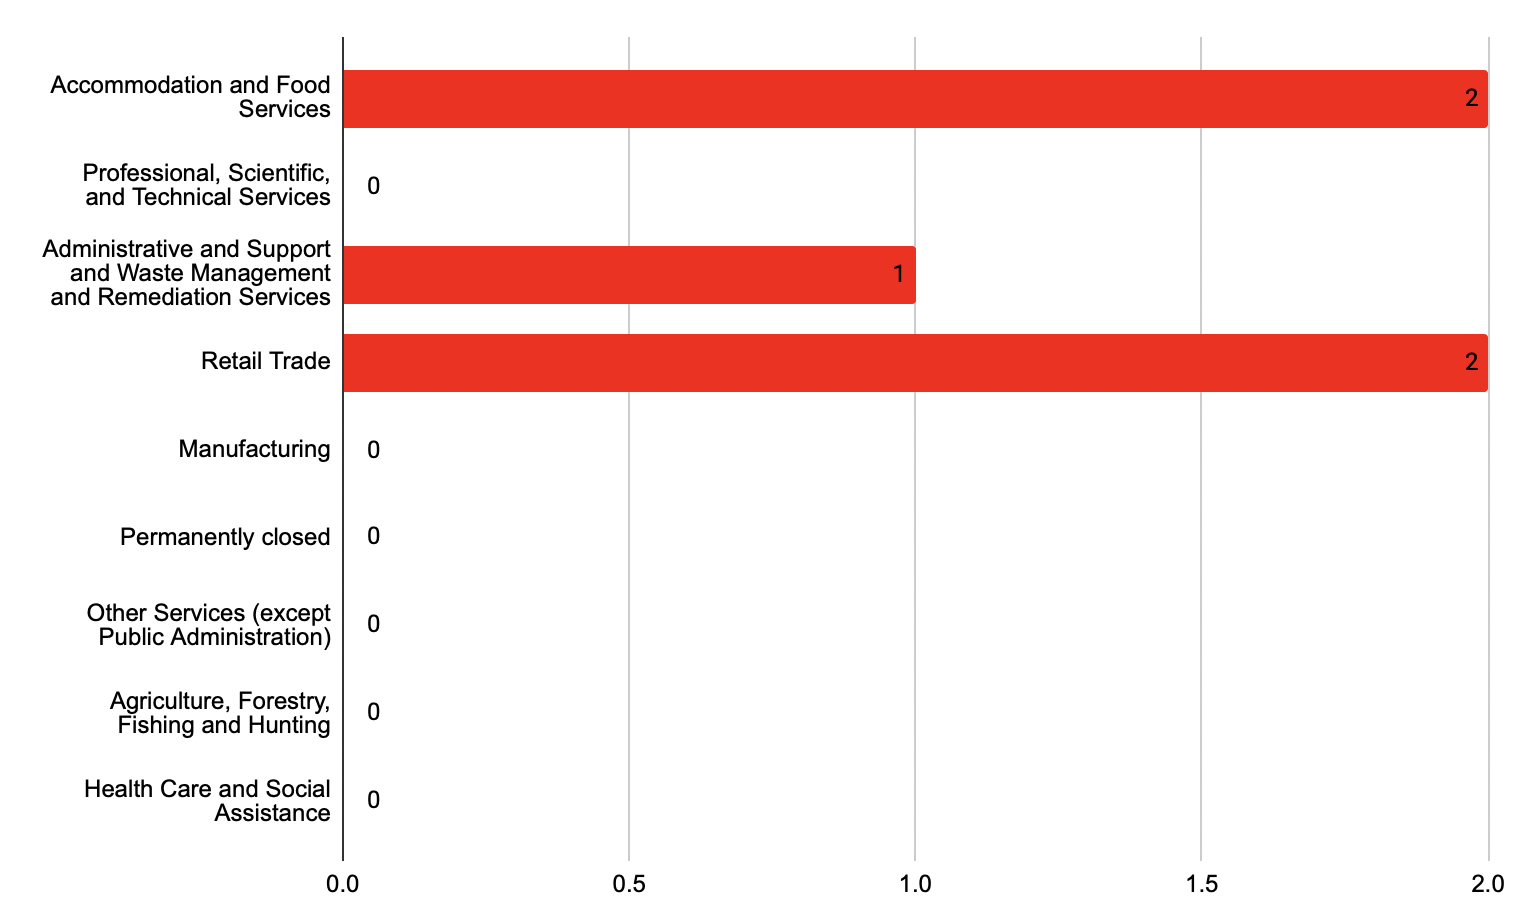
Investments by Industry

Note: These industry categories are based on the North American Industry Classification System (NAICS) codes, which is a classification of business establishments and types used by the United States government. Above we have listed the top 21 industries in the NAICS system.
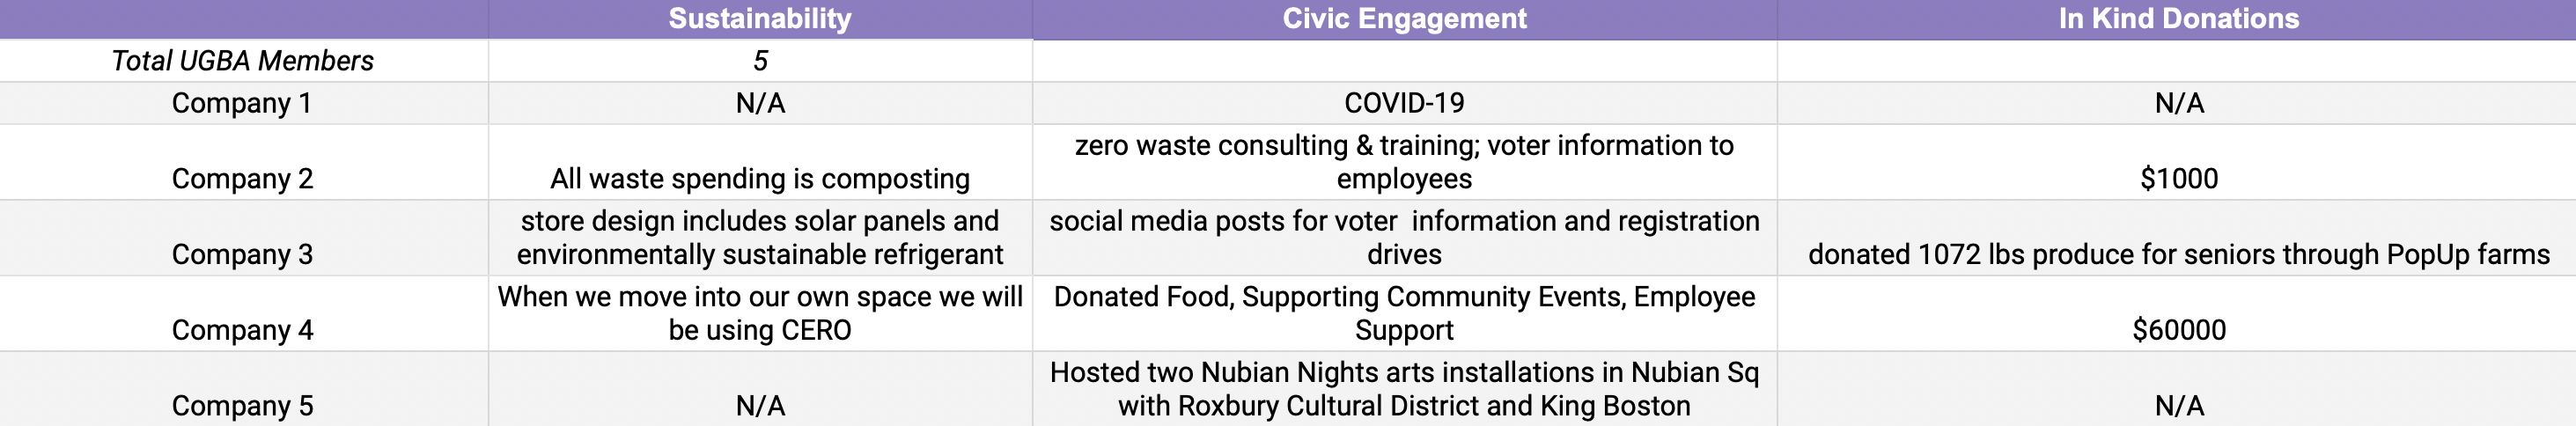
About the Ujima Good Business Alliance
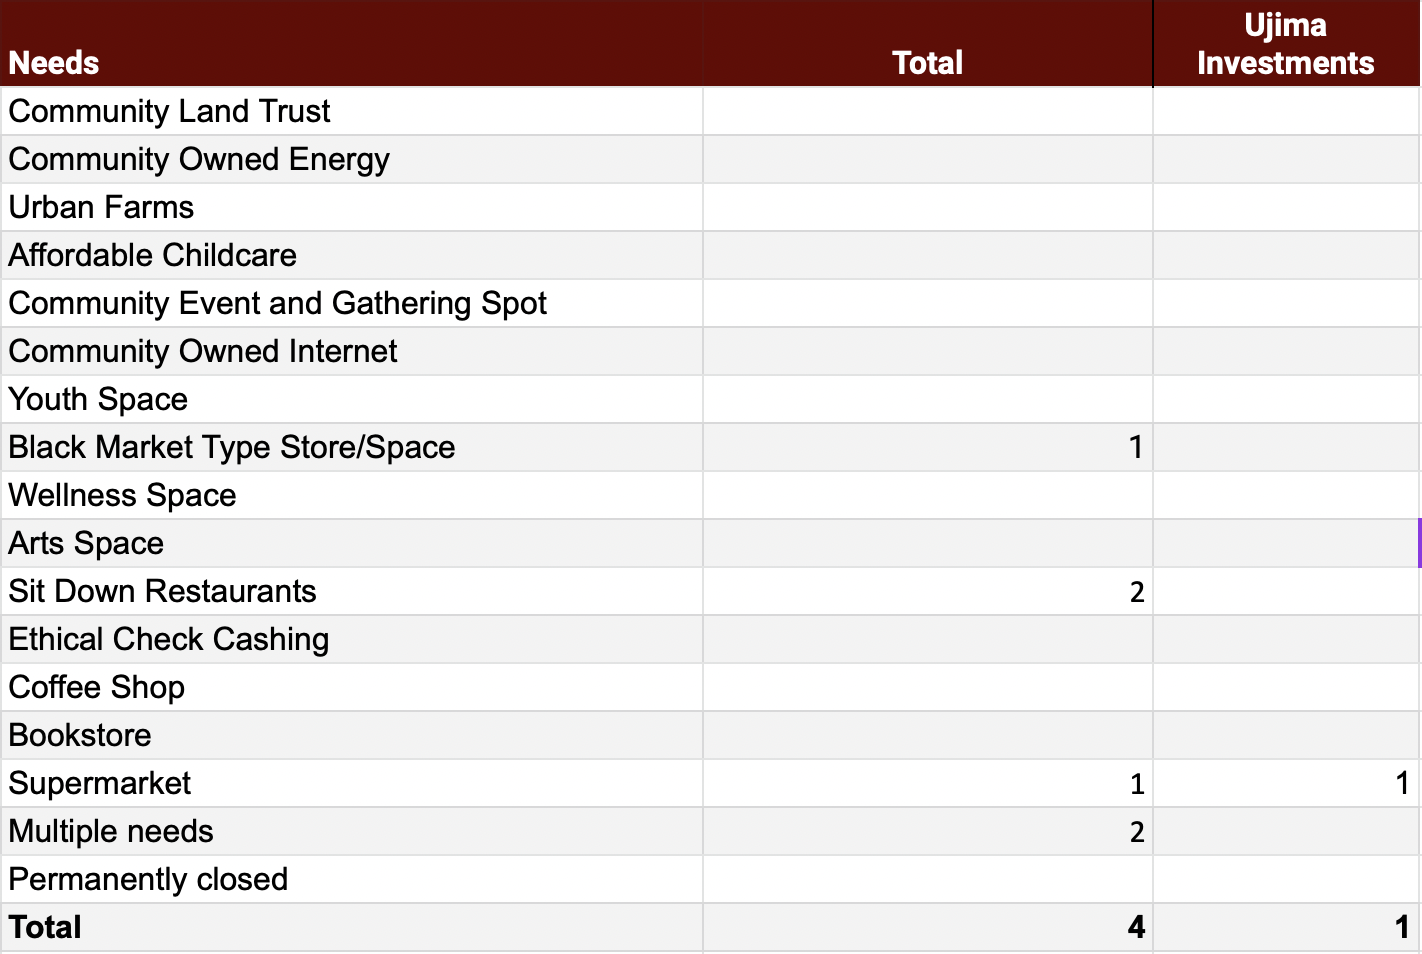
UGBA x Community Needs
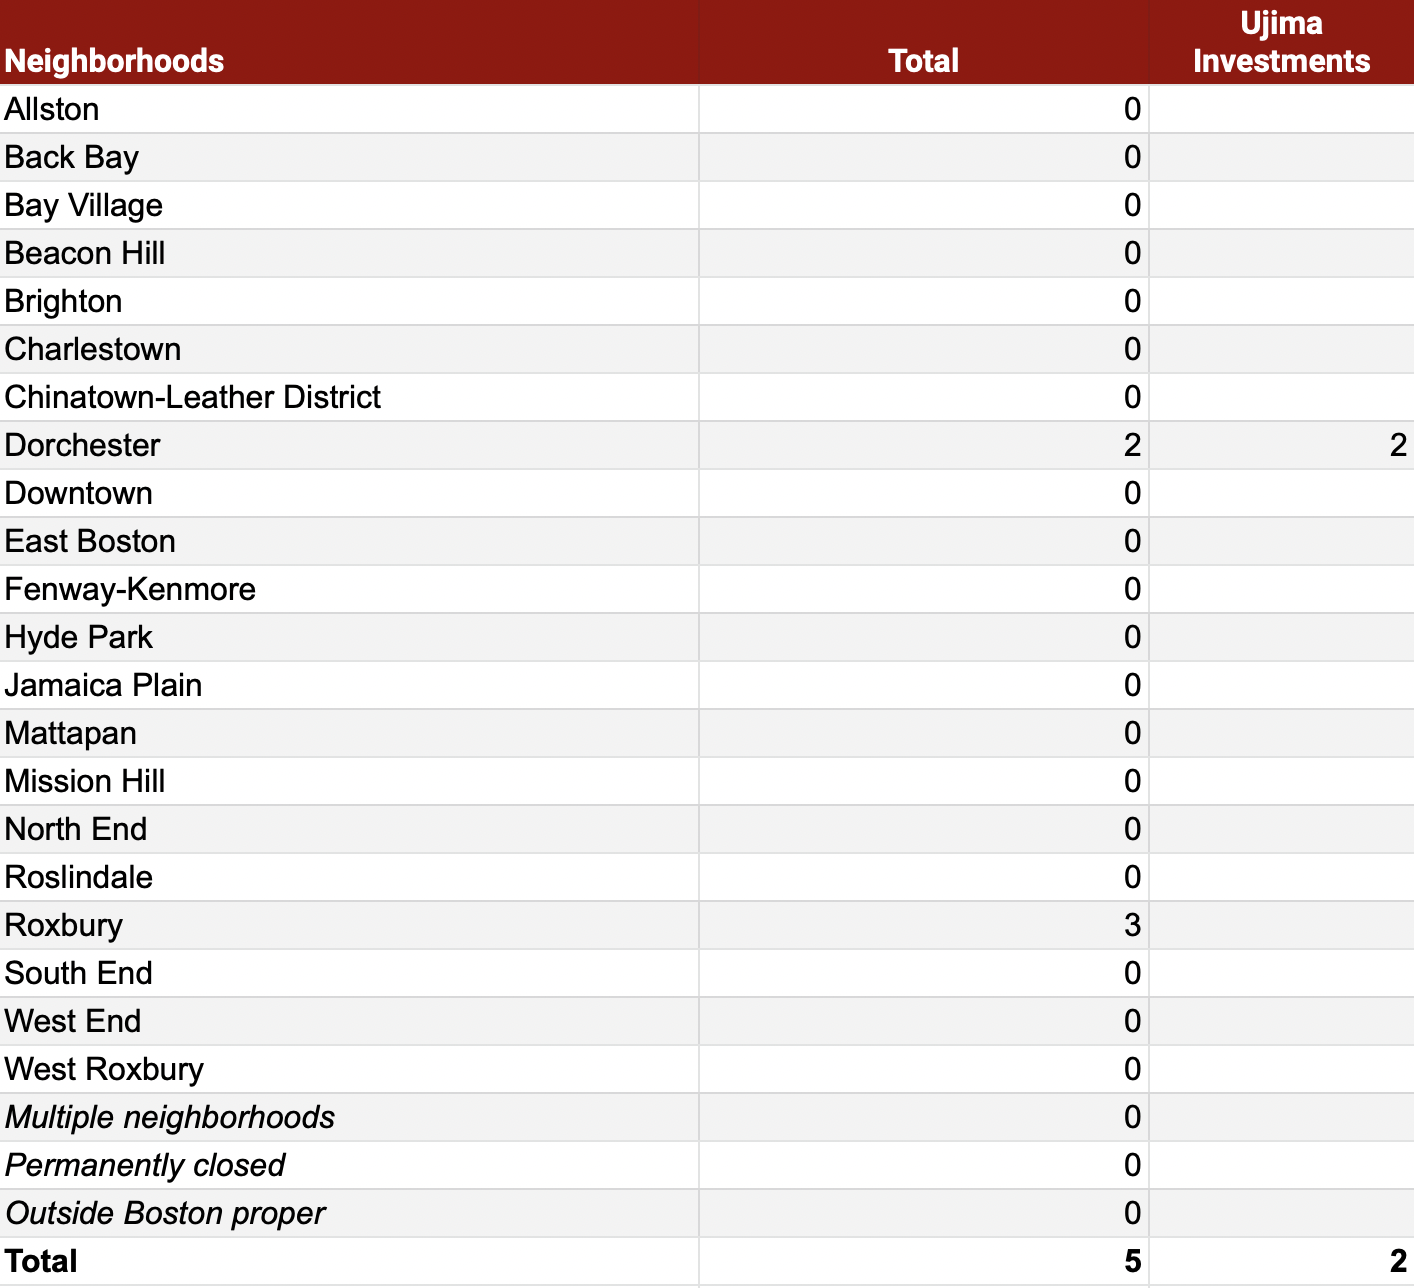
UGBA x Neighborhood
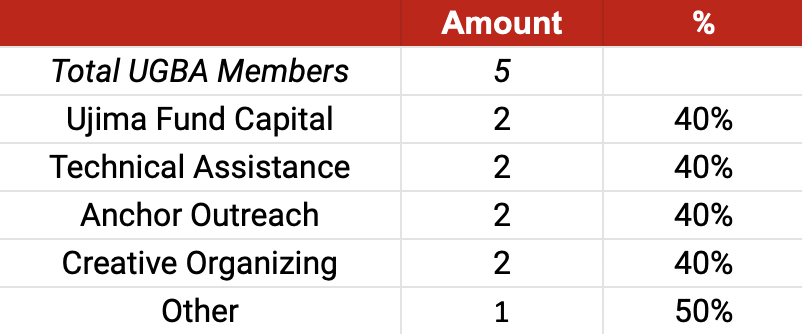
Current UGBA Support Needs
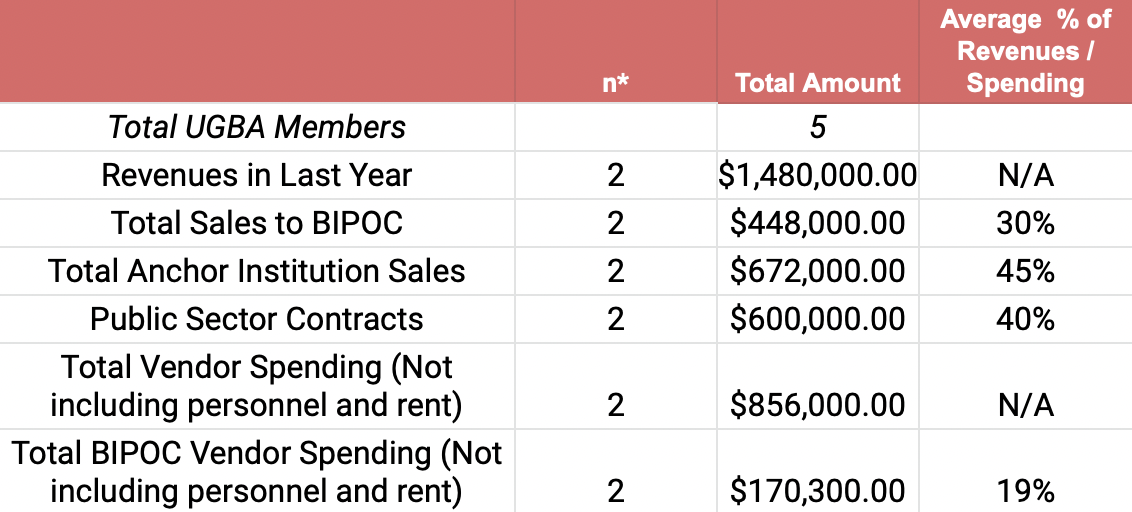
UGBA Customers and Vendors
UGBA Members by Sector
UGBA Certifications

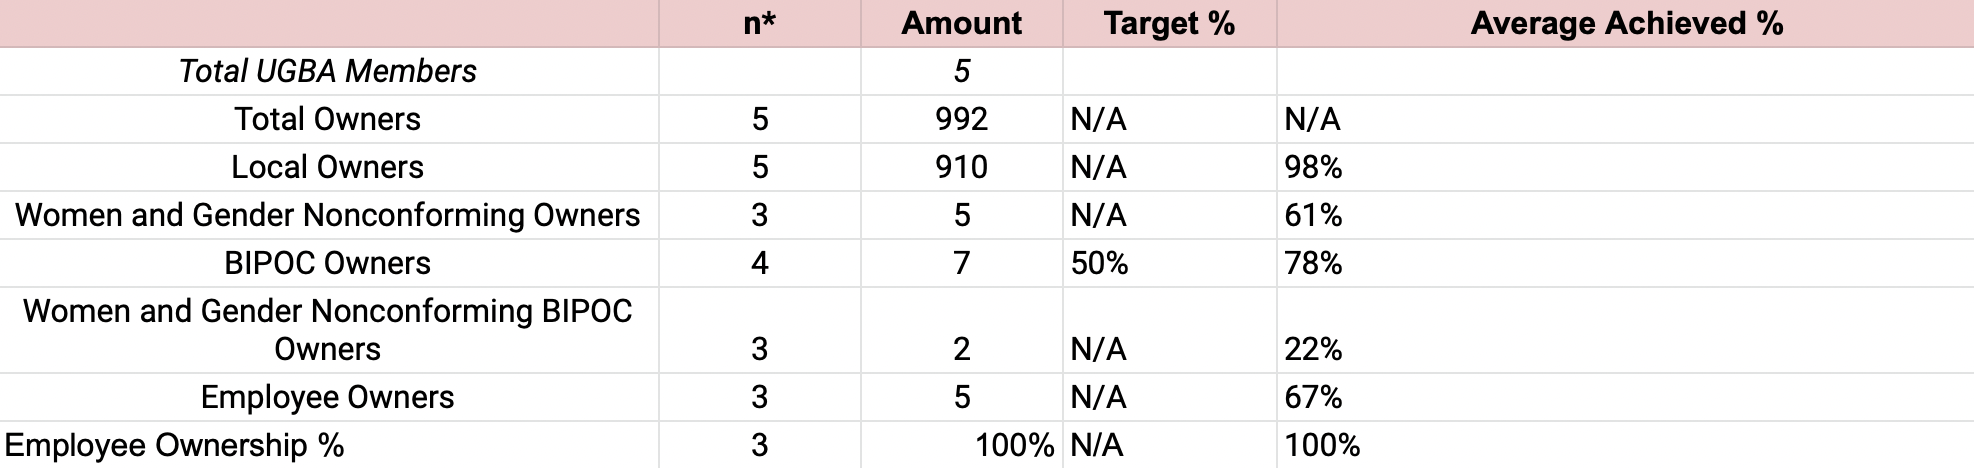
UGBA x Community Ownership
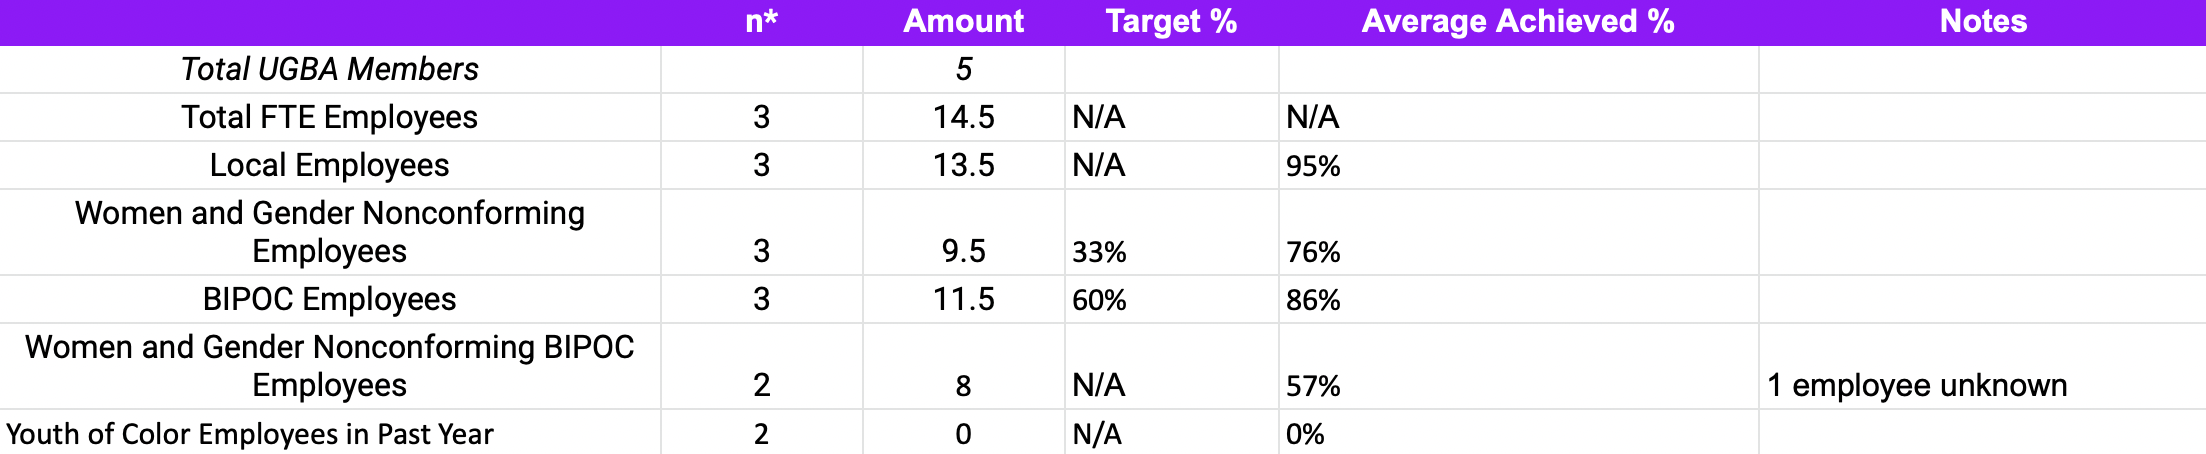
UGBA Workers
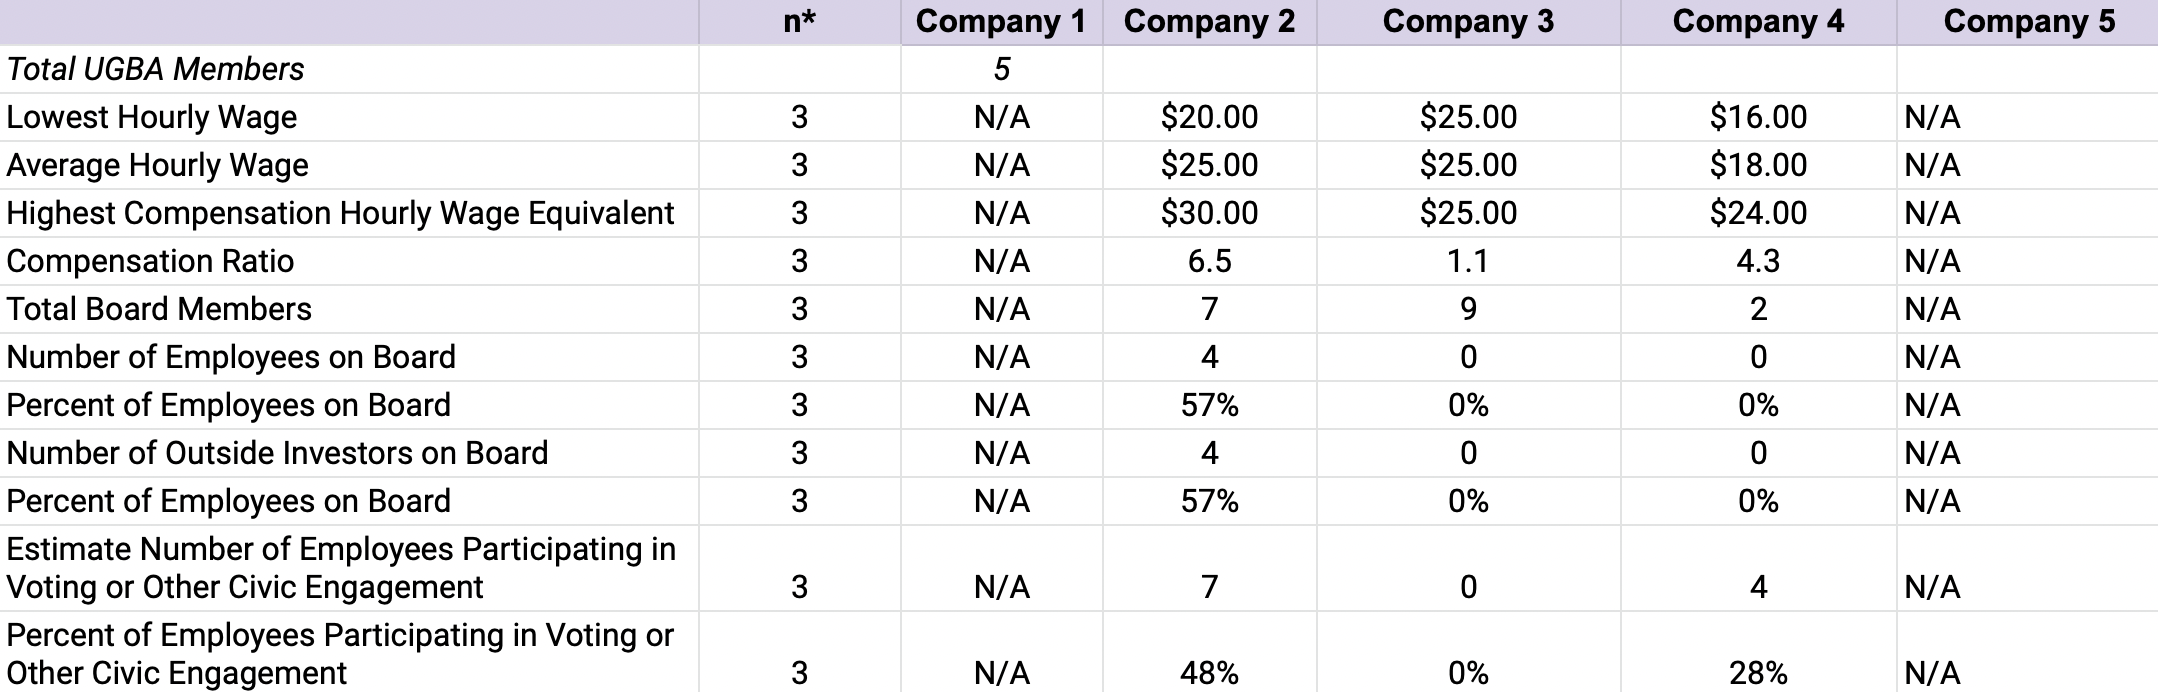
UGBA Good Jobs and Worker Power
UGBA x Health, Safety and Environment

UGBA x Environment and Community Power
About the Ujima Fund Investors
Investor Contributions by Note Type
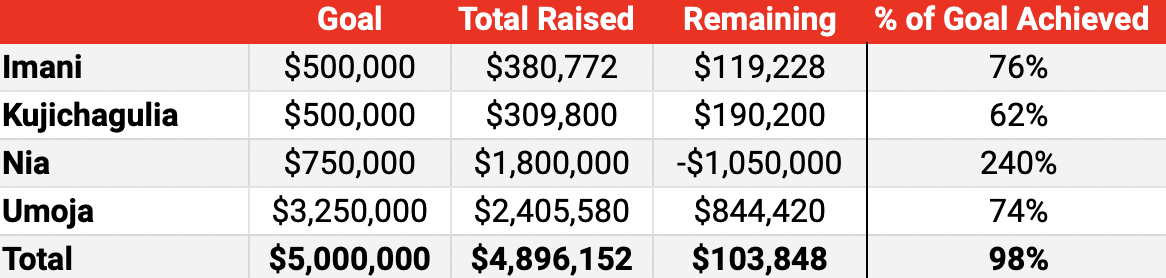
Total investments raised to date compared to goal
Investors by Member Status
Many of our investors—37%—also participate in the ecosystem as Ujima members.
This means they attend #UjimaWednesdays, participate in member teams, and, for Boston residents, vote on investments.

Note: Since Ujima members must be individuals, institutions that invest in Ujima,
such as foundations or financial institutions, are not counted as members
All Investors, by Race/Ethnicity
With 32% of our investors identifying as BIPOC, Ujima celebrates the representation of people of color within our investor class.
In the future, Ujima intends to devote time and resources to explore more deeply what it means to have nearly 55% representation by white investors, no representation by those who identify as Indigenous, and very little representation by those who identify as Pacific Islander, among our investors.
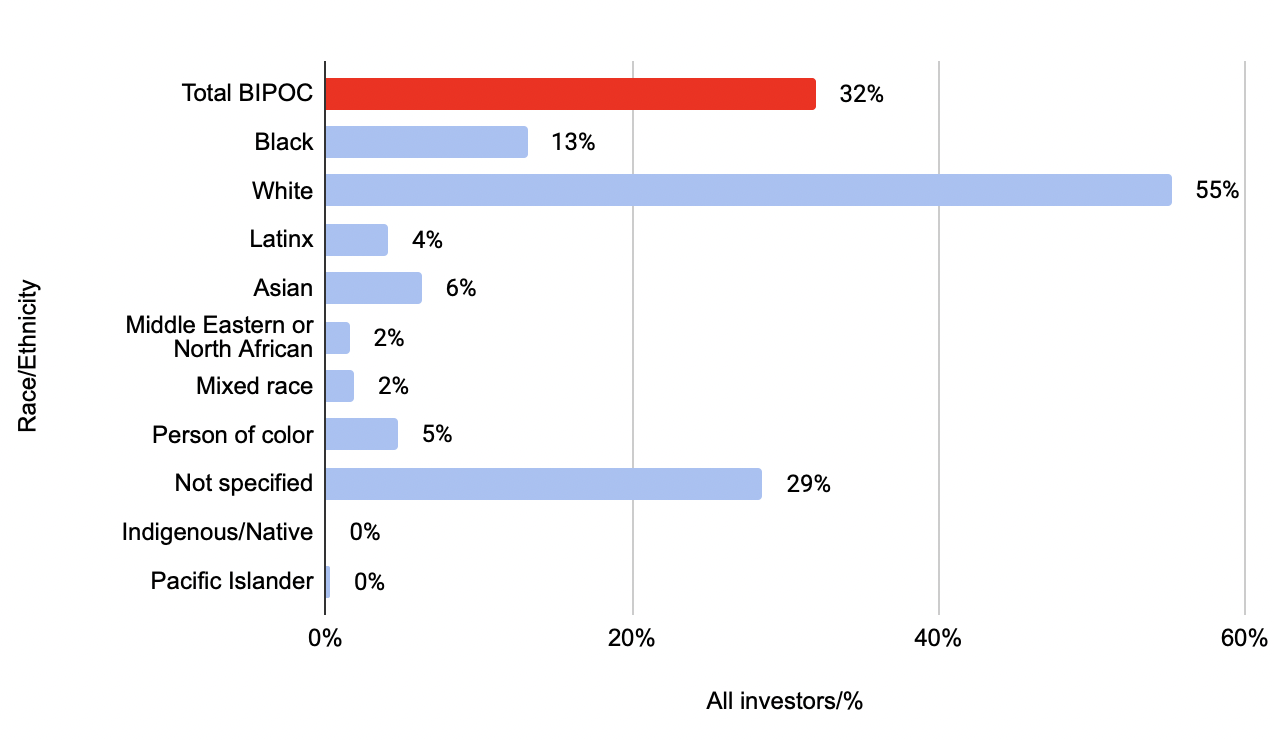
Note: Totals do not add up to 100%. To respect how our investors self-identify and ensure that we capture the full diversity of our investors, we have chosen to tabulate all racial/ethnic categories indicated by investors on their investment forms. As a result, several investors have been double-counted.
“Total BIPOC”. This bar includes all investors who identified as a race/ethnicity other than “White.”
“Not specified”. Overall, more than one-third of investors chose not to specify their racial/ethnic identity when they invested with us. Currently, BIPOC investors comprise 32% of the group, compared to 55% of white investors. If unspecified investors were in reality people of color, the total range of people of color represented among our investors could be anywhere from 32% to 68%.
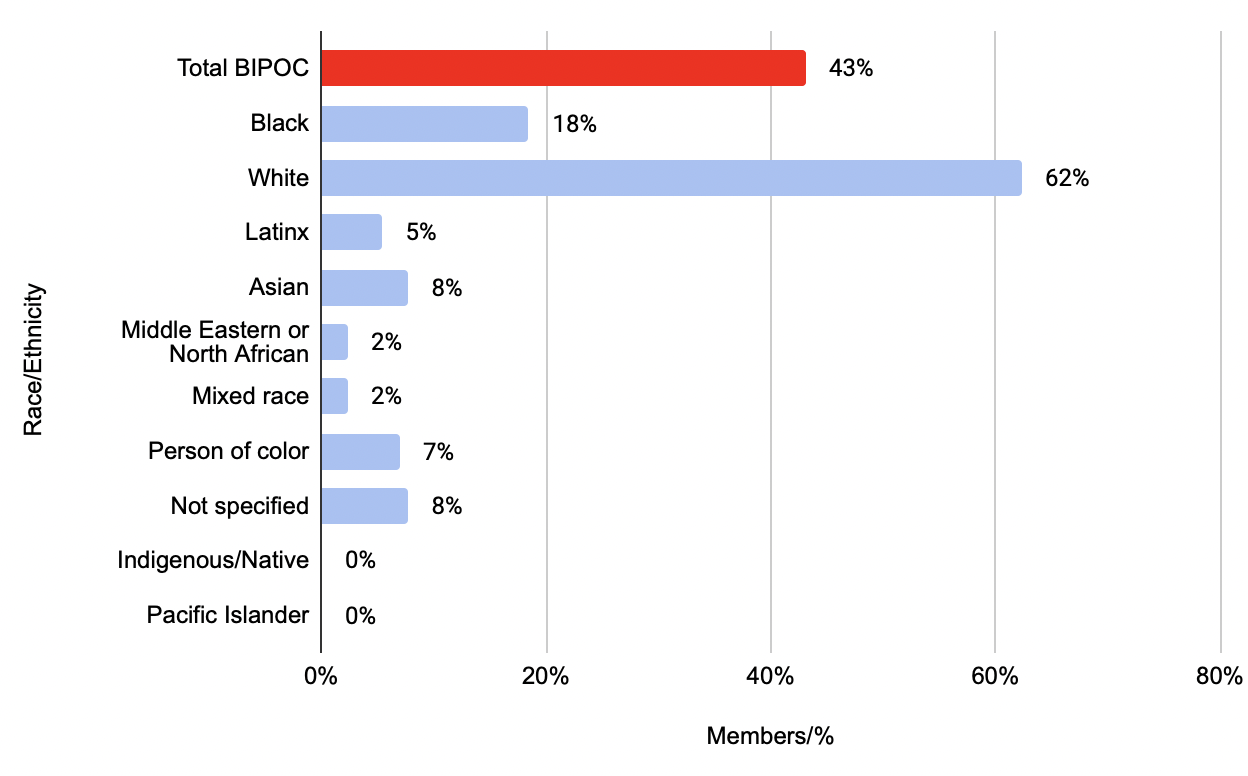
Investors who are Ujima Members by Race/Ethnicity
Investors who are not Ujima Members by Race/Ethnicity

Back to 2022 Investor Update