THE PEARL
INVESTMENT BALLOT
ABOUT THIS BALLOT
From May 9 to 23, 2023, Ujima members voted on our investment ballot for The Pearl. We successfully reached quorum on The Pearl Investment Ballot on Tuesday, May 23, 2023. Members overwhelmingly approved a $200,000 loan over 5 years. Overall, 59.32% of the electorate participated in this vote.
In February 2023, after being named as a business loved by members, The Pearl joined Ujima’s Good Business Alliance, a network of community-based businesses that are eligible for investment from the Ujima Fund and other supportive programs.
Below, we highlight information pooled from our Voting members including final results and demographic data.
VOTERS:
TOTAL ELIGIBLE VOTERS: 236QUOROM: 119
TOTAL VOTERS IN BALLOT: 140
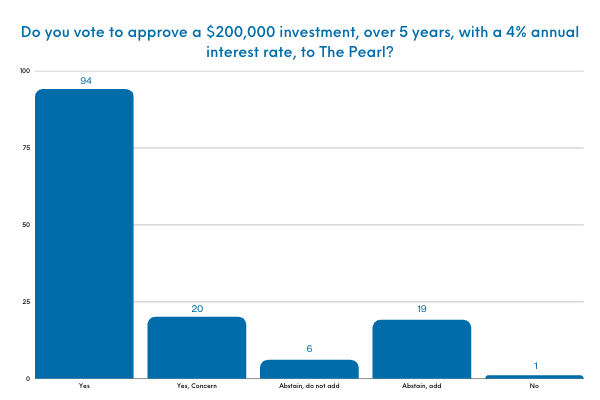
RESULTS BREAKDOWN:
APPROVE: 94APPROVE WITH CONCERN:20
ABSTAIN, AFFIRM MAJORITY: 19
ABSTAIN, DO NOT ADD: 6
NO: 1
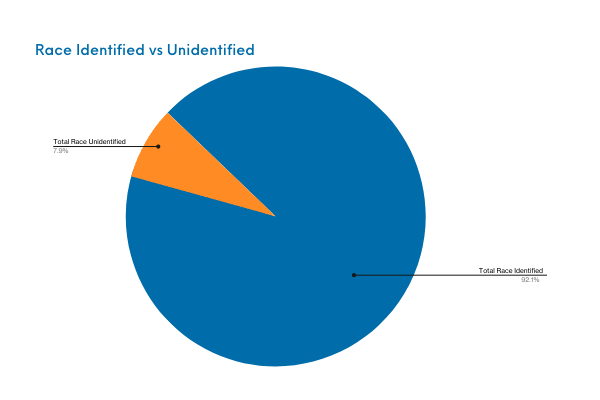
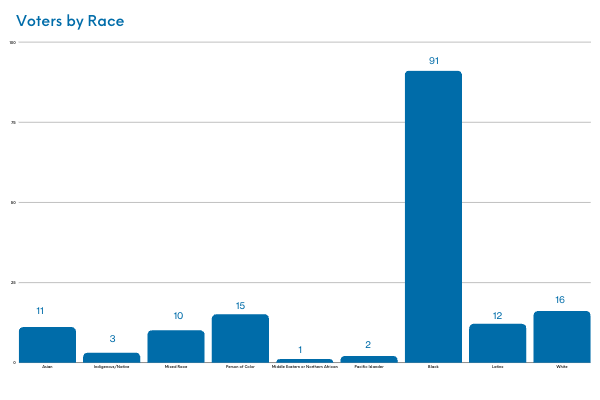
VOTERS BY RACE:
Total Race Identified: 129Total Race Unidentified: 11
Total POC: 120 (93.02%)
Asian: 11
Indigenous/Native: 3
Mixed Race: 10
Person of Color: 15
Middle Eastern or Northern African: 1
Pacific Islander: 2
Black: 91
Latinx: 12
White: 16
Lowest Possible POC: 85.71%
Highest Possible POC: 93.57%
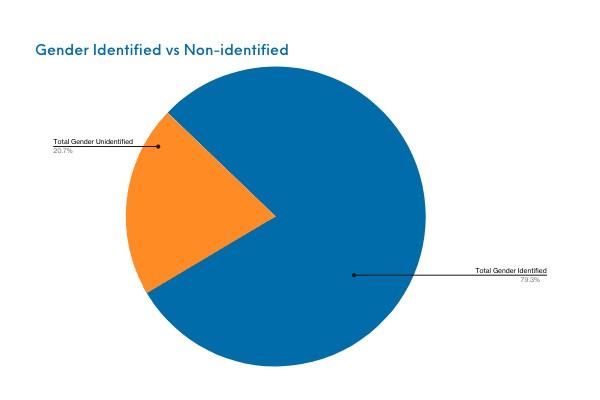
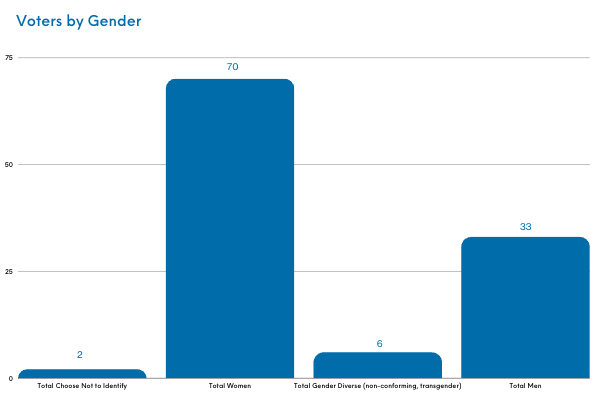
VOTERS BY GENDER:
Total Gender Identified: 111Total Gender Unidentified: 29
Total Choose Not to Identify: 2 (1.80%)
Total Women: 70 (63.06%)
Total Gender Diverse (non-conforming, transgender): 6 (4.41%)
Total Men: 33 (29.73%)
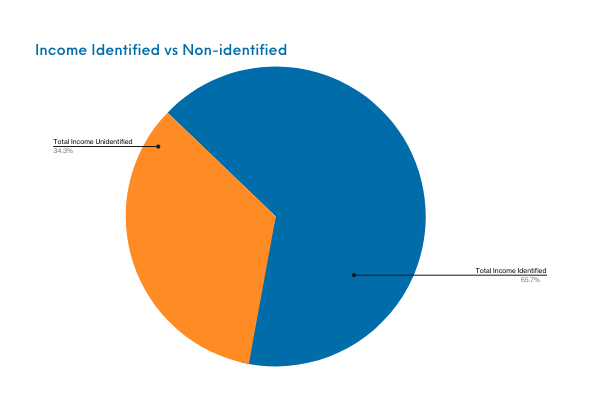
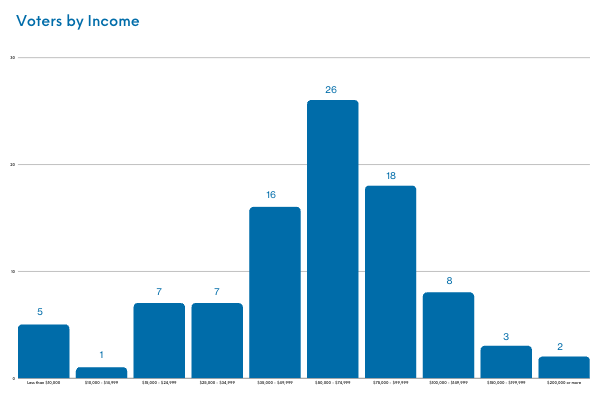
VOTERS BY INCOME:
Total Income Identified: 92Total Income Unidentified: 48
Less than $10,000: 5
$10,000 - $14,999: 1
$15,000 - $24,999: 7
$25,000 - $34,999: 7
$35,000 - $49,999: 16
$50,000 - $74,999: 26
$75,000 - $99,999: 18
$100,000 - $149,999: 8
$150,000 - $199,999: 3
$200,000 or more: 2
Total Working Class Income: 36 (39.13%)
Total Non Working Class Income: 57
Lowest Possible Working Class Income: 25.71%
Highest Possible Working Class Income: 84 (60%)
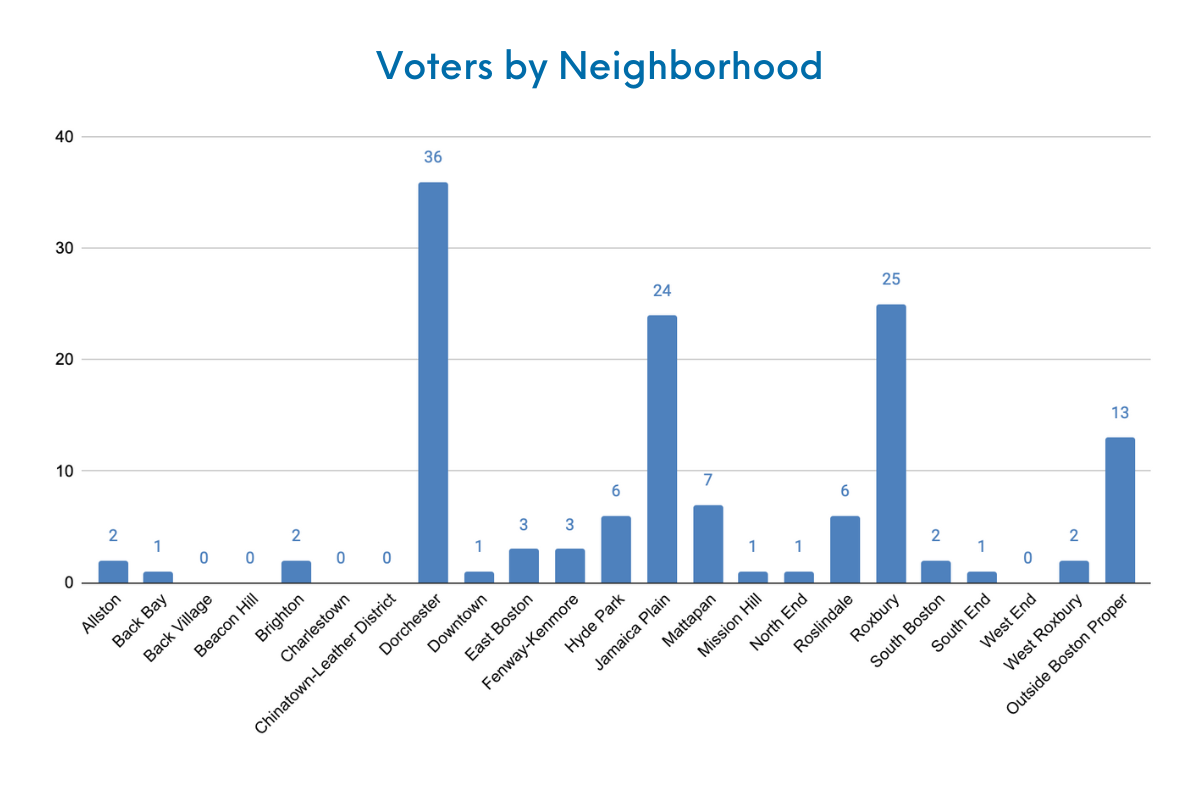
VOTERS BY NEIGHBORHOOD:
Total Voting: 140
Total Neighborhood Identified: 140
Allston: 2 (1.43%)
Back Bay: 1 (0.71%)
Bay Village: 0 (0.00%)
Beacon Hill: 0 (0.00%)
Brighton: 2 (1.43%)
Charlestown: 0 (0.00%)
Chinatown-Leather District: 0 (0.00%)
Dorchester: 36 (25.71%)
Downtown: 1 (0.71%)
East Boston: 3 (2.14%)
Total Neighborhood Identified: 140
Allston: 2 (1.43%)
Back Bay: 1 (0.71%)
Bay Village: 0 (0.00%)
Beacon Hill: 0 (0.00%)
Brighton: 2 (1.43%)
Charlestown: 0 (0.00%)
Chinatown-Leather District: 0 (0.00%)
Dorchester: 36 (25.71%)
Downtown: 1 (0.71%)
East Boston: 3 (2.14%)
VOTERS BY NEIGHBORHOOD:
Fenway-Kenmore: 3 (2.14%)Hyde Park: 6 (4.29%)
Jamaica Plain: 24 (17.14%)
Mattapan: 7 (5.00%)
Mission Hill: 1 (0.71%)
North End: 1 (0.71%)
Roslindale: 6 (4.29%)
Roxbury: 25 (17.86%)
South Boston: 2 (1.43%)
South End: 1 (0.71%)
West End: 0 (0.00%)
West Roxbury: 2 (1.43%)
Outside Boston Proper: 13 (9.29%)
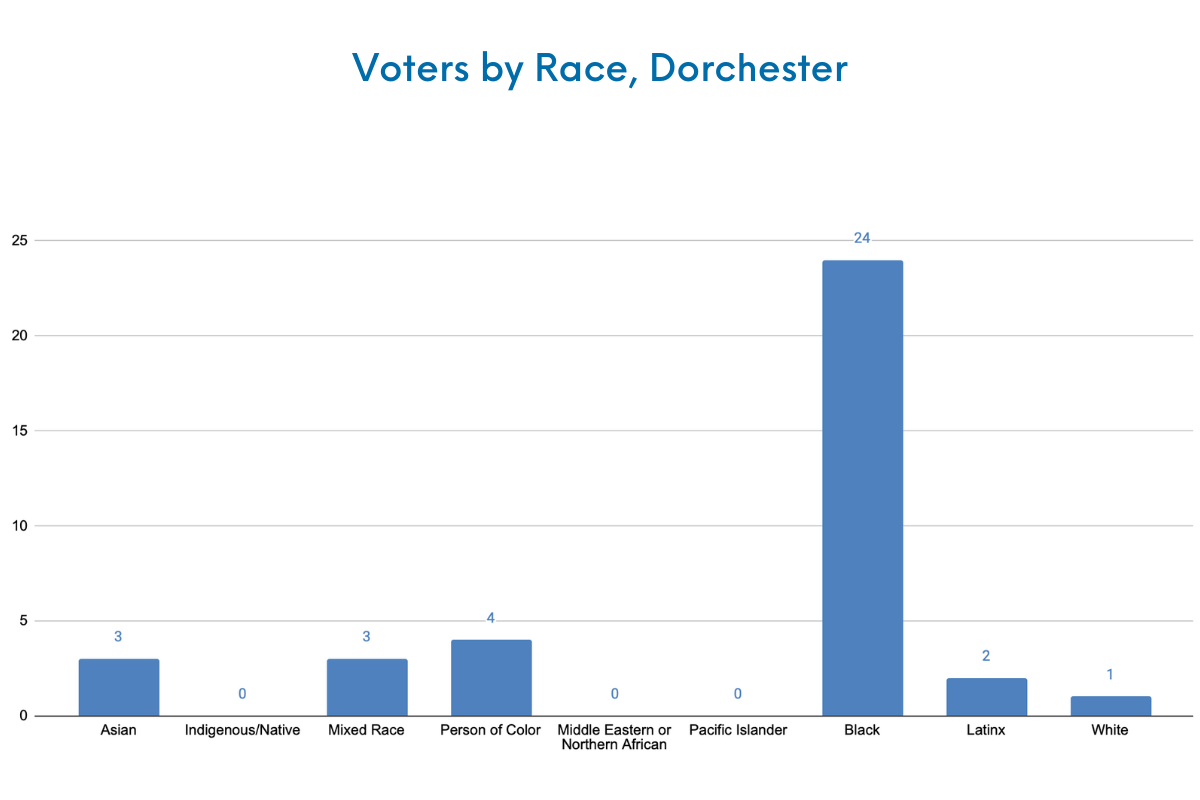
VOTERS x Dorchester:
Total Voting: 36
Total Race Identified: 33
Total Race Unidentified: 3
Total BIPOC: 33 (100%)
Asian: 3
Indigenous/Native: 0
Mixed Race: 3
Person of Color: 4
Middle Eastern or Northern African: 0
Pacific Islander: 0
Black: 24
Latinx: 2
White: 1
Lowest Possible POC: 91.67%
Highest Possible POC: 100.00
Total Race Identified: 33
Total Race Unidentified: 3
Total BIPOC: 33 (100%)
Asian: 3
Indigenous/Native: 0
Mixed Race: 3
Person of Color: 4
Middle Eastern or Northern African: 0
Pacific Islander: 0
Black: 24
Latinx: 2
White: 1
Lowest Possible POC: 91.67%
Highest Possible POC: 100.00
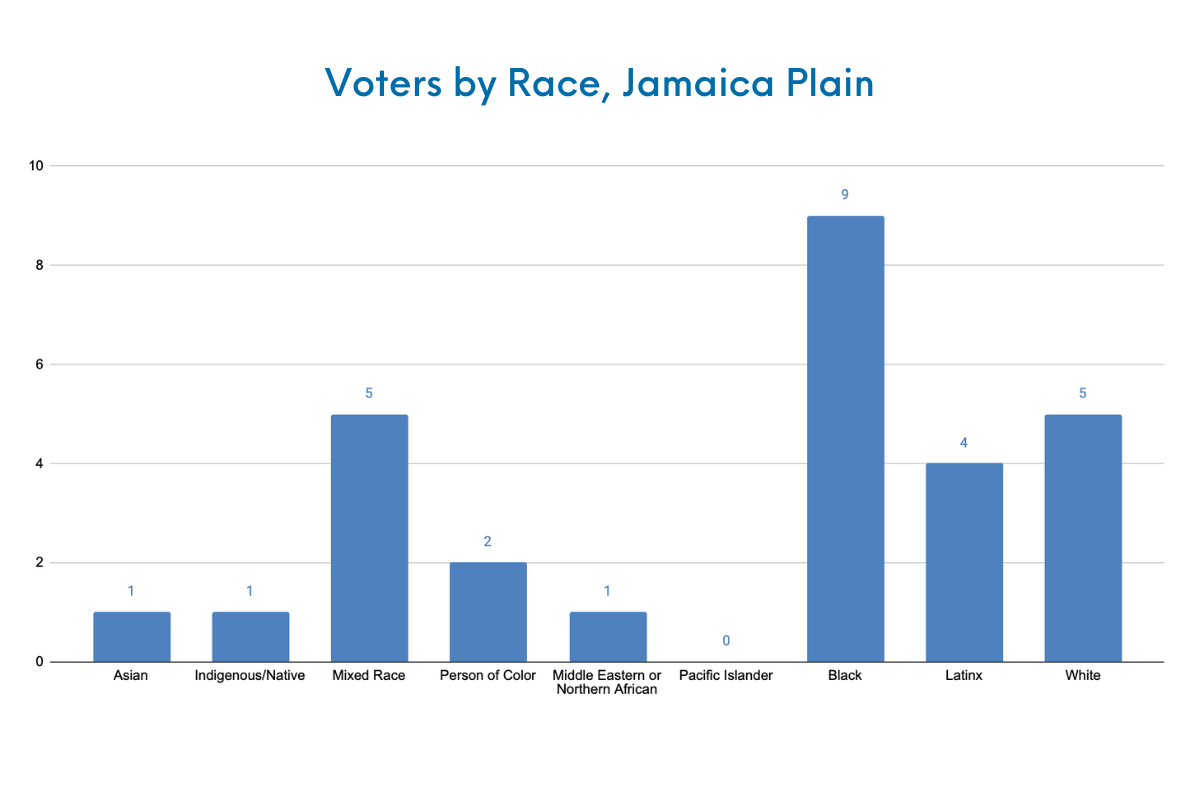
VOTERS x Jamaica Plain
Total Voting: 24
Total Race Identified: 20
Total Race Unidentified: 4
Total BIPOC: 15 (75.00%)
Asian: 1
Indigenous/Native: 1
Mixed Race: 5
Person of Color: 2
Middle Eastern or Northern African: 1
Pacific Islander: 0
Black: 9
Latinx: 4
White: 5
Lowest Possible POC: 62.50%
Highest Possible POC: 79.17%
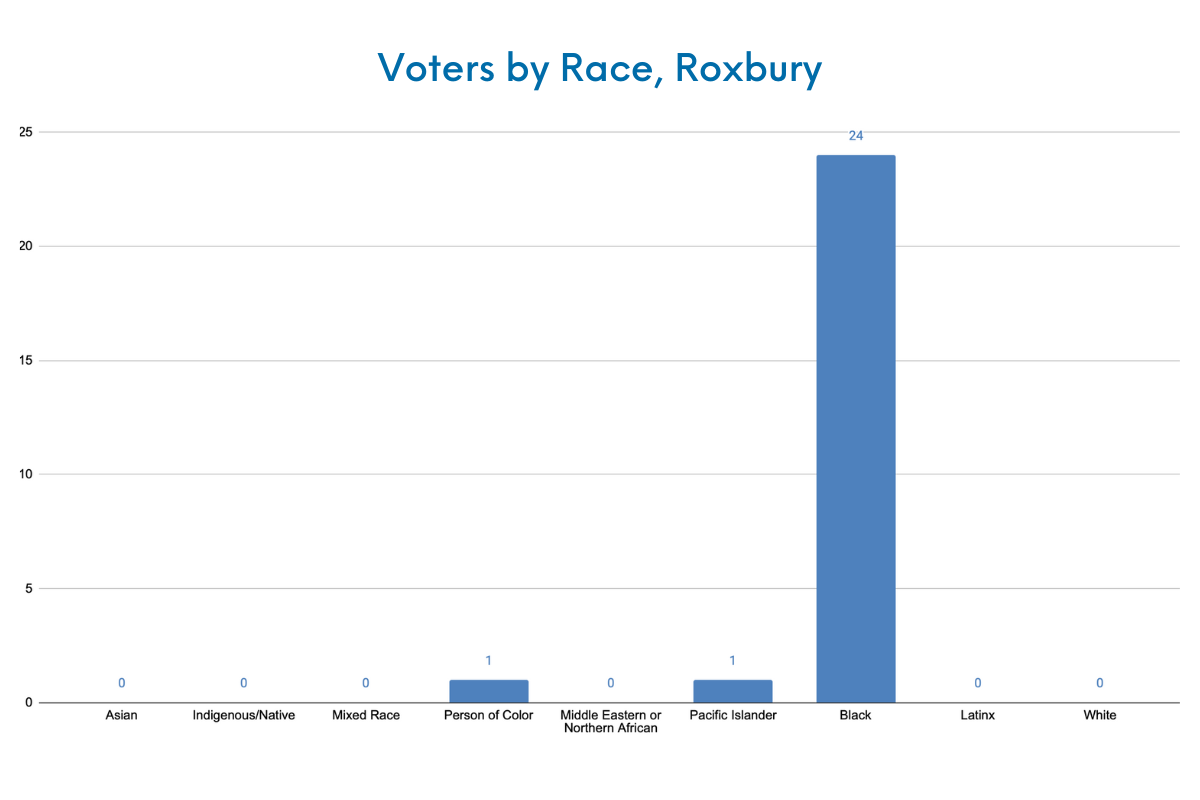
VOTERS x Roxbury
Total Voting: 25
Total Race Identified: 25
Total Race Unidentified: 0
Total BIPOC: 25 (100.00%)
Asian: 0
Indigenous/Native: 0
Mixed Race: 0
Person of Color: 1
Middle Eastern or Northern African: 0
Pacific Islander: 1
Black: 24
Latinx: 0
White: 0
Lowest Possible POC: 100.00%
Highest Possible POC: 100.00%
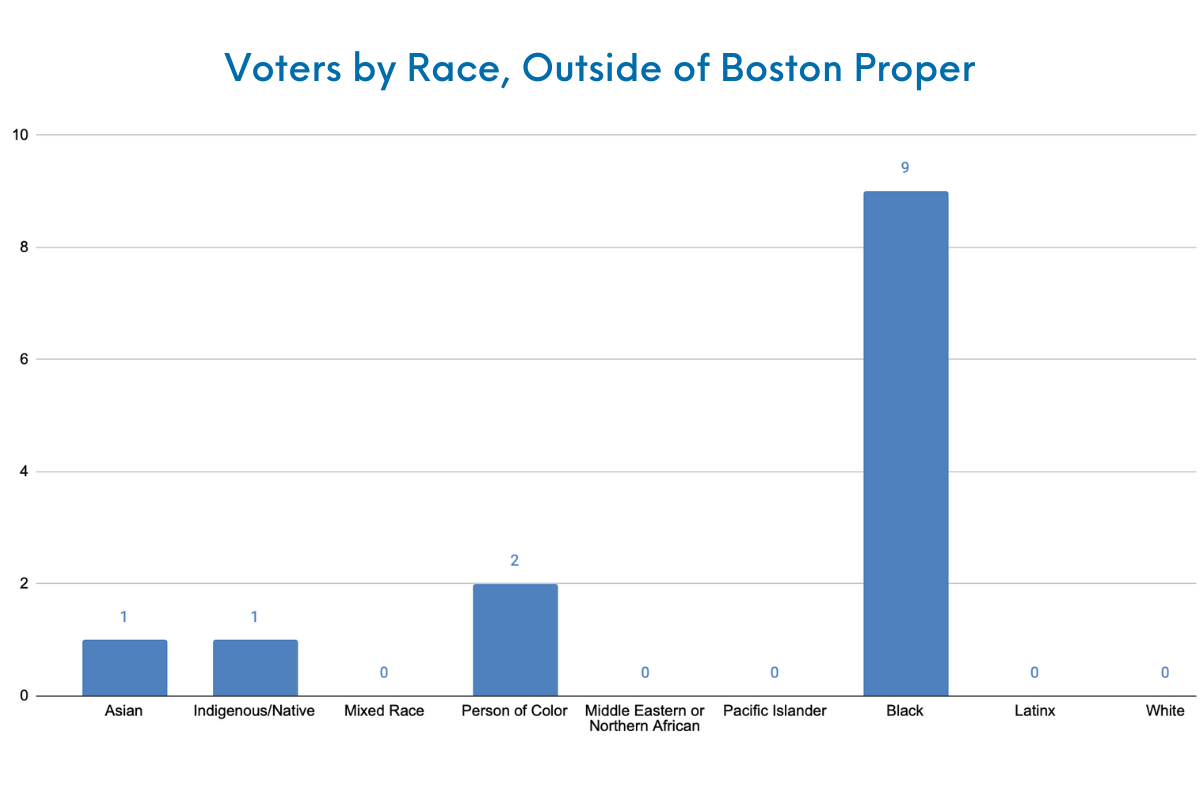
VOTERS x Outside of Boston
Total Voting: 13
Total Race Identified: 11
Total Race Unidentified: 2
Total BIPOC: 11 (100.00%)
Asian: 1
Indigenous/Native: 1
Mixed Race: 0
Person of Color: 2
Middle Eastern or Northern African: 0
Pacific Islander: 0
Black: 9
Latinx: 0
White: 0
Lowest Possible POC: 84.62%
Highest Possible POC: 100.00%
###